This resource is hosted by the Nelson Mandela Foundation, but was compiled and authored by Padraig O’Malley. It is the product of almost two decades of research and includes analyses, chronologies, historical documents, and interviews from the apartheid and post-apartheid eras.
Annexures
ANNEXURE A
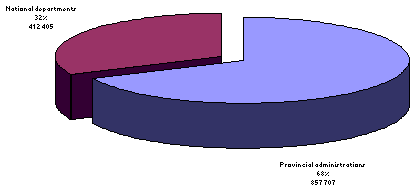
Figure 1A: Employment in the public service
(Payroll statistics as at 30 September 1995)
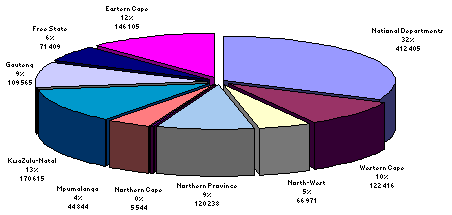
Figure 2A: Comparative employment statistics for national departments and provincial administrations
(Payroll statistics as at 30 September 1995)
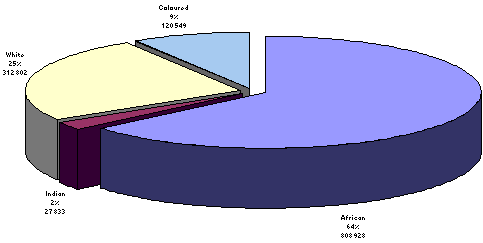
Figure 3A: The racial profile of the public service
(Payroll statistics as at 30 September 1995)
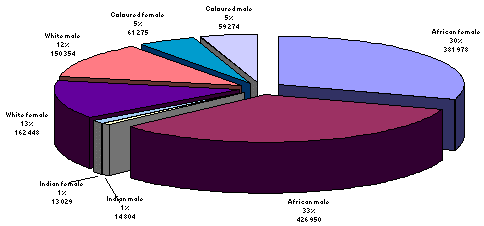
Figure 4A: The racial and gender profile of the public service
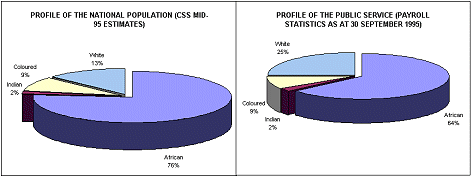
Figure 5A: A comparison between the racial profiles of the National Population and the Public Service
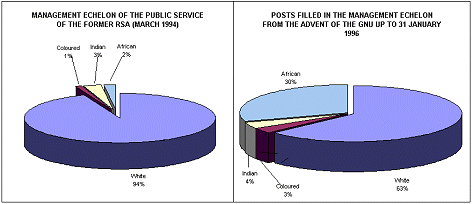
Figure 6A: Progress towards representativeness: Comparison between the management echelon of the public services of the former RSA and the present GNU
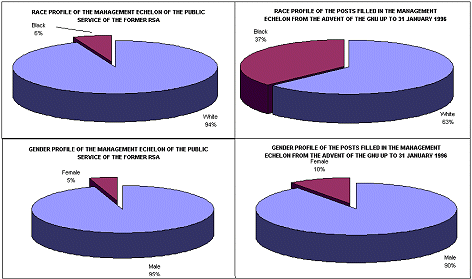
Figure 7A: Progress towards representativeness: race and gender comparison
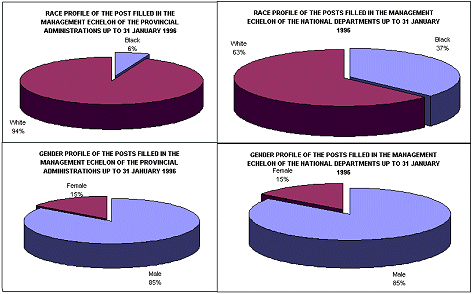
Figure 8A: Progress towards representativeness: comparison between the national departments and the provincial administrations
ANNEXURE B
EARLY TERMINATION OF SERVICES IN THE MANAGEMENT ECHELON
The Commission considers all requests and representations for the early termination of services of officers in the management echelon. The Commission recommended the following early termination of services during the year under review:
Authorising provision of the Public Service Act, 1994
Number | ||
1994 | 1995 | |
Section 16(4) (compulsory retirement upon reaching a certain age) | 1 | 0 |
Section 16(6)(a) (retirement to the advantage of the State) | 39 | 120 |
Section 17(2)(a) (discharge on account of continued ill health) | 10 | 24 |
Section 17(2)(b) (discharge owing to rationalisation) | 4 | 16 |
Section 17(2)(c) (discharge in the interest of the, Public Service) | 0 | 1 |
Section 17(4) (termination of service owing to other reasons) | 3 | 2 |
Section 17(6) (discharge by President) | 0 | 0 |
Total | 57 | 163 |
Sources:
Republic of South Africa. 1995a. Annual Report: Public Service Commission, RP138/1995, Government Printer, Pretoria.
Republic of South Africa. 1996a. Annual Report: Public Service Commission, RP76/1996:10-11), Government Printer, Pretoria.
ANNEXURE C
To support the functions of the Commission in promoting a broadly representative Public Service, a dedicated component was created at Chief Directorate level in the Office of the Commission and became operational around the middle of the year under review. The Chief Directorate is responsible for advising the Commission on policy and programmes, as well as the monitoring of progress through a centrally established data base.
To facilitate progress at departmental level,. the Commission initiated the creation of components with departments/provincial administrations to assist management with the promotion of representativeness. By the end of 1995, "Special Programmes" components had been created in 15 departments and provincial administrations, and six "Special Programmes Officers" had been appointed to manage the process. Twelve departments and provincial administrations were already developing departmental plans to promote representativeness and one was geared to implement a plan at the beginning of 1996.
While the long-term strategy was being developed during 1994, it became clear that urgent changes in the composition of the Public Service were required and the commission initiated two short-term measures. These two initiatives showed definite sign of success in 1995 and the information collected during these exercises will be invaluable in planning longer term national and departmental programmes.
*In June 1994, approximately 11 000 vacant posts in the Public Service were identified and advertised in the "Jobs for South Africa" exercise targeted specifically at under-represented groups. Although progress was hampered by the logistics of dealing with 1,54 million applications and complicated by the ongoing restructuring and rationalisation of the Public Service, concrete results were achieved. The departments at national level offered 2 943 posts under this initiative. By 31 October 1995, 1 835 posts had been filled, of which 1 548 (84%) improved representativeness. The successful candidates comprised 825 (45%) Blacks, 139 (8%) Asians, 221 (12%) Coloureds and 650 (35%) Whites, while there were 852 (46% women). The advancement of disadvantaged groups from within the service was achieved by the promotion of 602 officials and there were 1 026 (56%) candidates appointed from outside the Public Service.
*After consulting with employee organisation within the Central Chambers of the Public Service bargaining Council, the Commission directed that certain posts on the rationalised organisational structures of departments may be utilised for promoting representativeness. Appointments in the management echelon of the new structures up to 31 December 1995 indicate that attention was given to improving representativeness. Although Whites continued to fill most of the posts in the management echelon, Blacks filled a significant number (37%), particularly at the highest level. Twenty of the 38 Directors-General were Black. Females filled 10% of the management echelon posts compared to only 5% in the Public Service of the former RSA.
Despite the success of the short-term initiatives, there is still a great deal to be done to achieve a broadly representative Public Service. Blacks constitute by far the most officials in the production worker category and the minority in the highly skilled supervisory and management ranks. Coloureds and Asians and women of all population groups are also poorly represented at management level. More programmes need to be put in place to train and develop suitable individuals so that the management structures can become broadly representative. Certain occupational classes have already been identified as possible target areas for specified programmes and others will follow once the "Special Programmes" components in departments / provincial administrations become fully operational.
Source: Republic of South Africa. 1996a. Annual Report: Public Service Commission, RP76/1996:10-11), Government Printer, Pretoria.
ANNEXURE D
SOUTH AFRICAN MANAGEMENT AND DEVELOPMENT INSTITUTE
The following number of persons attended courses and seminars presented by the during 1994 and 1995:
Number of persons trained | ||
Courses | 1994 | 1995 |
Management training | 7 656 | 2474 |
Training common to all departments | 1 144 | 751 |
Training in general skills | 513 | 683 |
Training of training personnel | 1 116 | 566 |
Seminars | - | 133 |
Management aspects | 3 176 | 3481 |
Functions common to all departments | 795 | 987 |
General skills | 364 | 175 |
Total | 14764 | 9250 |
Sources:
Republic of South Africa. 1995a. Annual Report: Public Service Commission, RP138/1995, Government Printer, Pretoria.
Republic of South Africa. 1996a. Annual Report: Public Service Commission, RP76/1996:10-11), Government Printer, Pretoria.
ANNEXURE E
PENSION FUNDS AND BENEFITS
A project with the object of creating a unified pension dispensation in accordance with the constitutional provisions relating to the Public Service was launched. A project team, consisting of representatives of the State as employer, employee organisations and of certain other interest groups and private sector experts, was established.
The proposals made by the project team inter alia entail that a new Act be enacted which will replace all the existing pension acts. All the existing government pension funds will be rationalised into one pension fund to be managed by a Board of Trustees, consisting equally of representatives of the State as employer and the employee organisations. The rationalised pension fund will have a uniform benefit structure for each Public Service sector, uniform contribution rates and with no gender or other discrimination in benefits.
Source: Republic of South Africa. 1996a. Annual Report: Public Service Commission, RP76/1996:10-11), Government Printer, Pretoria.
ANNEXURE F
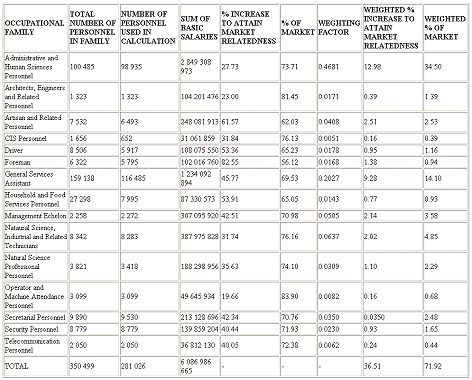
SALARY BACKLOG OF THE 15 MAJOR OCCUPATIONAL FAMILIES IN THE PUBLIC SERVICE AS DETERMINED BY COMPARING THE SPECIFIC PUBLIC SERVICE SALARY SCALE WITH COMPARABLE MARKET INFORMATION
Click on image to enlarge
* TOTAL NUMBER OF PERSONNEL IN PUBLIC SERVICE AS ON 30 APRIL 1994 - 975 777 (excluding parastatal institutions and local government but including National Defence Force 82 618 persons; South African Police Services 103 724 persons; Educators 280 380 persons.
Payroll information as on 30 April 1994 were used to calculate the relationship of certain ranks to the occupational family as a whole.
Kindly note that the salary account consists of the sum of actual salary notches of personnel on the payroll.
Source: Republic of South Africa, Public Service Commission: Official communication 17 July 1995.
ANNEXURE G
POLICY DOCUMENT
(Updated with adjustments until 1 April 1994)
PART I: REMUNERATION POLICY OF THE PUBLIC SERVICE
BROAD POLICY AIMS
The remuneration policy is aimed at enabling the State as employer, within the confines of affordability, to recruit and retain sufficient personnel of the desired quality, in the open labour market for the execution of state functions in a satisfactory manner. It is also aimed at a satisfied personnel corps and the maintenance of labour peace.
APPROACHES TO REALIZE THE POLICY AIMS
Personnel are classified into a number of occupational classes on the basis, of distinctive fields of work.
Occupational classes are grouped into a number of occupational families on the basis of specific relationships. An occupational family may also consist of only one occupational class.
Salary structure(s) and standard service dispensation measures are designed for each occupation family in a way that ensures the maintenance of harmony and equilibrium within the occupational family and between occupational families.
Only in exceptional circumstances, where factors playing a role in the determination of service dispensations indicate significant differences, should deviations from the core salary structure occur.
3. FACTORS WHICH MAY PLAY A ROLE IN THE DETERMINATION OF SERVICE DISPENSATIONS
1.. Remuneration and other benefits in the labour market.
2.. The qualitative and quantitative personnel position in occupational classes.
3.. Needs of the employer.
4.. Needs of employees.
5.. Internal relationships within and between occupational families.
6.. Affordability with due consideration to national priorities.
7.. Sound labour relations.
8.. Conditions of supply and demand in the labour market.
4. WAYS IN WHICH SERVICE DISPENSATIONS ARE MAINTAINED
Service dispensations may be maintained in one or a combination of the following ways:
1.. General salary adjustments applicable to all personnel.
2.. Structural adjustments during which the total salary structure of (an) occupational family/families are revised.
3.. Occupational specific adjustments on a selective basis during which specific elements of the dispensation of an occupational class are adjusted.
4.. Improvement of general conditions of service such as housing benefits, leave, etc.
5. PROCEDURE FOR THE ADJUSTMENT OF SERVICE DISPENSATIONS
Adjustments to service dispensations are effected in accordance with a system where adjustments are negotiated with recognised employee organizations.
Source: Republic of South Africa. Public Service Commission, Official Communication, 17 July 1995
